Plot Eval MOPTW
eval_plot_moptw(
  n_points = 5L,
  N = 200L,
  K = 100L,
  xmin,
  xmax,
  alpha,
  theta,
  beta,
  lambda,
  parallel = FALSE
)
Arguments
| n_points | Number of points to form the plot; |
|---|---|
| N | Maximum number of sums of the external sum of Eq. 19 of the paper. |
| K | Maximum number of sums of the interior sum of Eq. 19 of the paper. |
| xmin | Minimum value for the domain. This parameter allows you to control the x axis |
| xmax | Maximum value for the domain. This parameter allows you to control the x axis |
| alpha | Parameter added by the proposed family. |
| theta | Parameter added by the proposed family. |
| beta | Scale parameter of the Weibull distribution. |
| lambda | Shape parameter of the Weibull distribution. |
| parallel | If |
Value
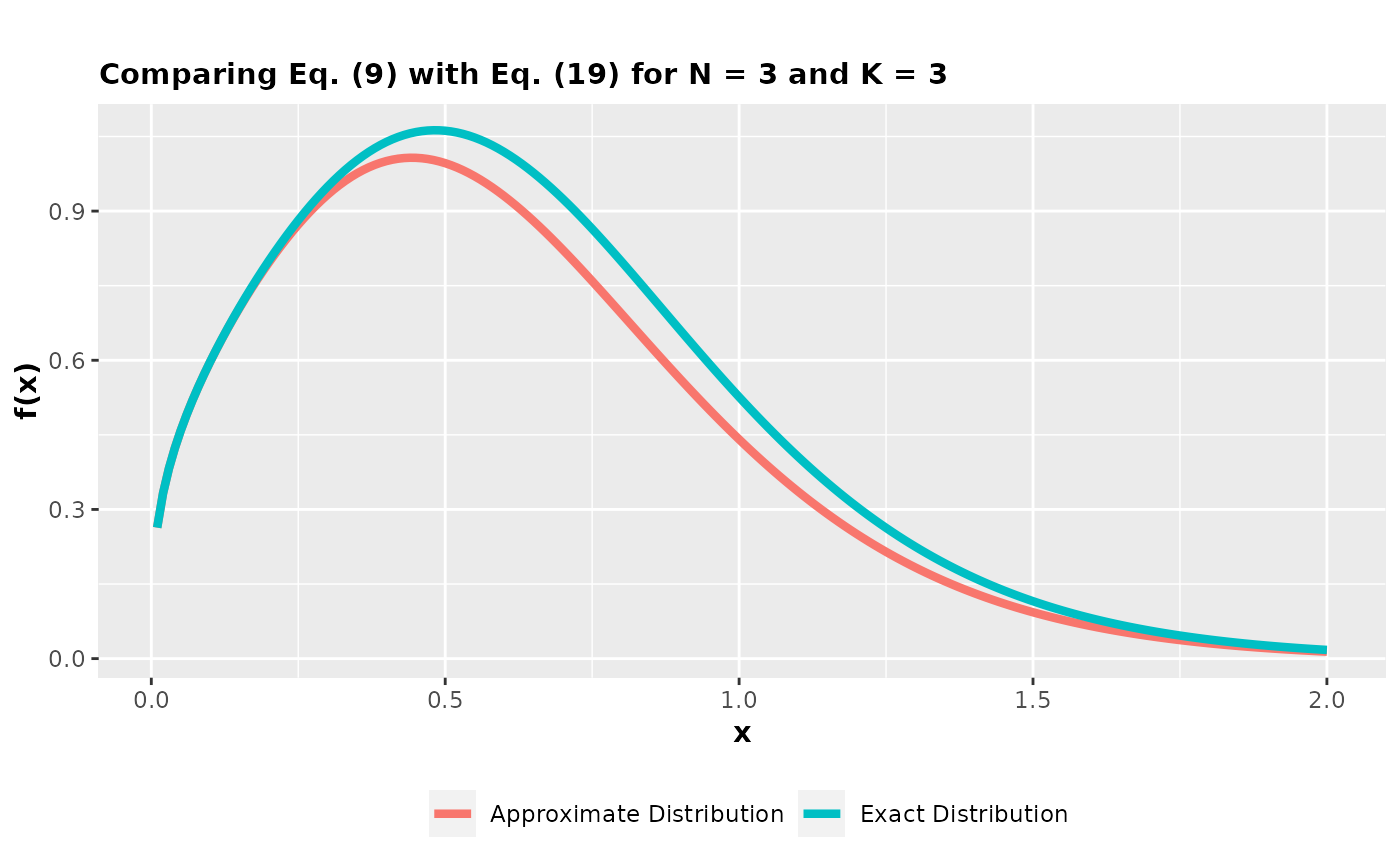
Line graph comparing the theoretical distribution of Eq. 9 of the paper with an approximation, considering finite sums, by Eq. 19 of the paper.
Examples
eval_plot_moptw(
   n_points = 200L,
   N = 3L,
   K = 3L,
   xmin = 0.01,
   xmax = 2,
   alpha = 1.2,
   theta = 1.5,
   beta = 1.33,
   lambda = 2
)