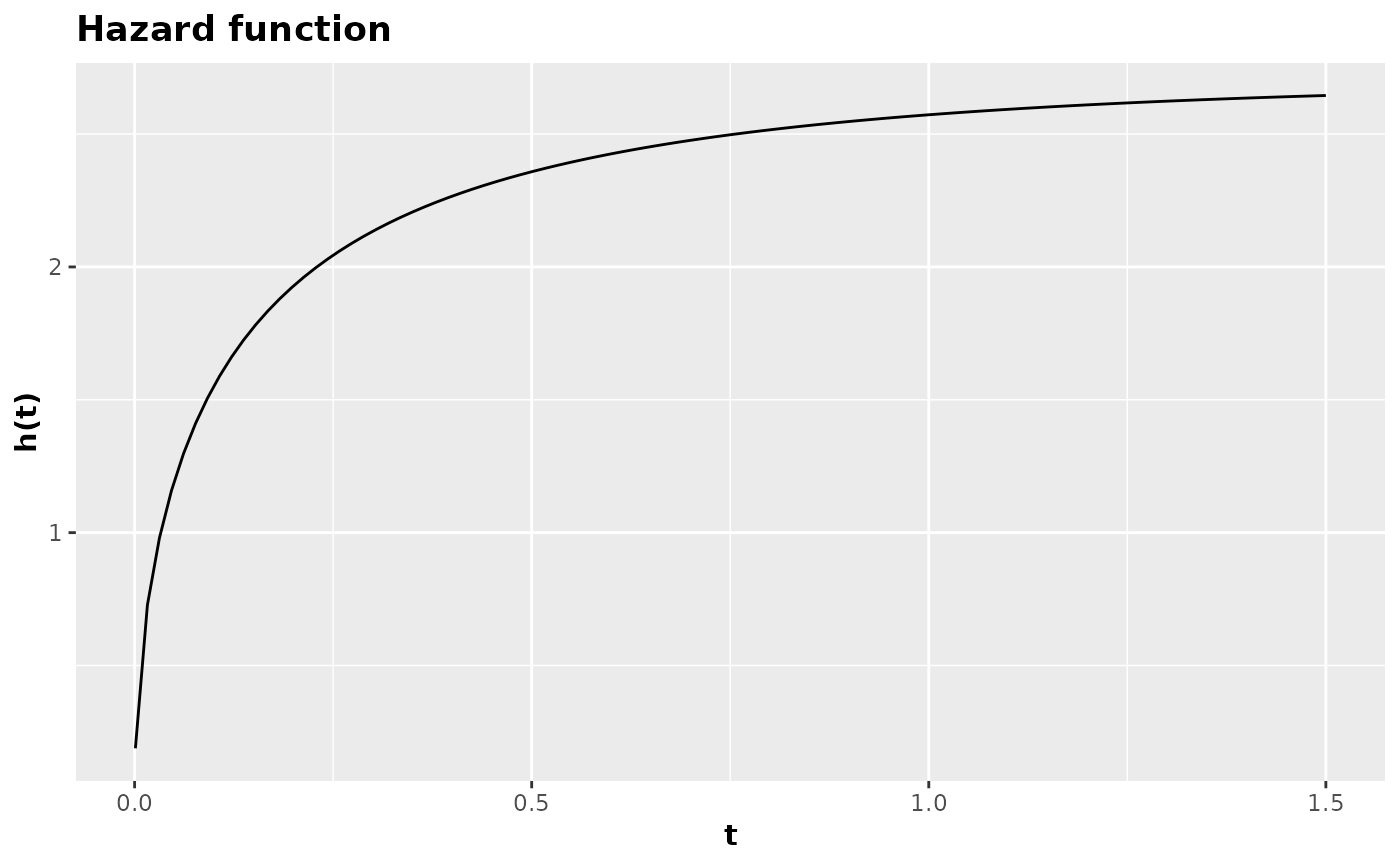
Plot of the hazard function
plot.hazard_function.RdConstructs the plot of the hazard function of an object of the
hazard_function class.
Usage
# S3 method for hazard_function
plot(x, ...)
Arguments
- x
A numeric vector representing the dataset.
- ...
Additional arguments to be passed to the ggplot function.
References
NADARAJAH, Saralees; KOTZ, Samuel. The beta exponential distribution. Reliability engineering & system safety, v. 91, n. 6, p. 689-697, 2006.
Examples
# Saraless Nadarajah and Samnuel Kotz (2006)
beta_exponential <- function(x, a, b, lambda){
 lambda / beta(a, b) * exp(-b * lambda * x) * (1 - exp(-lambda * x))^(a - 1)
}

hazard_beta_exponential <- hazard_function(beta_exponential)

hazard_beta_exponential(
  t = seq(0.001, 1.5, length.out = 100L),
  a = 1.5,
  b = 1.8,
  lambda = 1.5
) |> plot()
