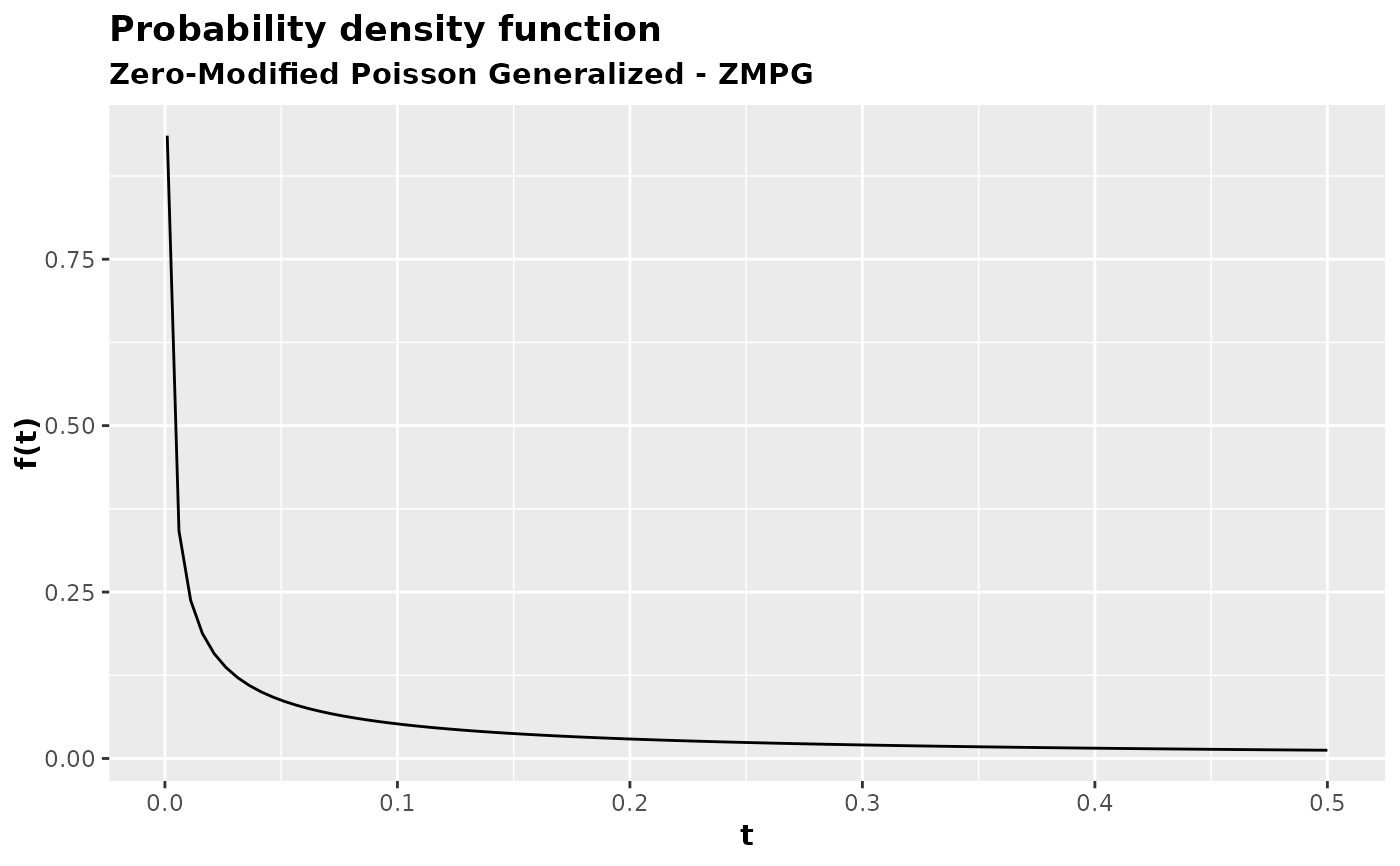
Plot of the probability density function (PDF) of ZMPG frailty.
plot.pdf_fragility_zmpg.RdConstructs a plot of the probability density function (PDF) of ZMPG frailty.
Usage
# S3 method for pdf_fragility_zmpg
plot(x, ...)
Arguments
- x
A numeric vector representing the dataset.
- ...
Additional arguments to be passed to the ggplot function.
Examples
zmpg_weibull <- pdf_fragility_zmpg(pdf = dweibull)
zmpg_weibull(
  t = seq(0.001, 0.5, length.out = 100L),
  mu = 0.7,
  phi = 0.6,
  rho = 0.1,
  shape = 0.5,
  scale = 1.2
) |> plot()
