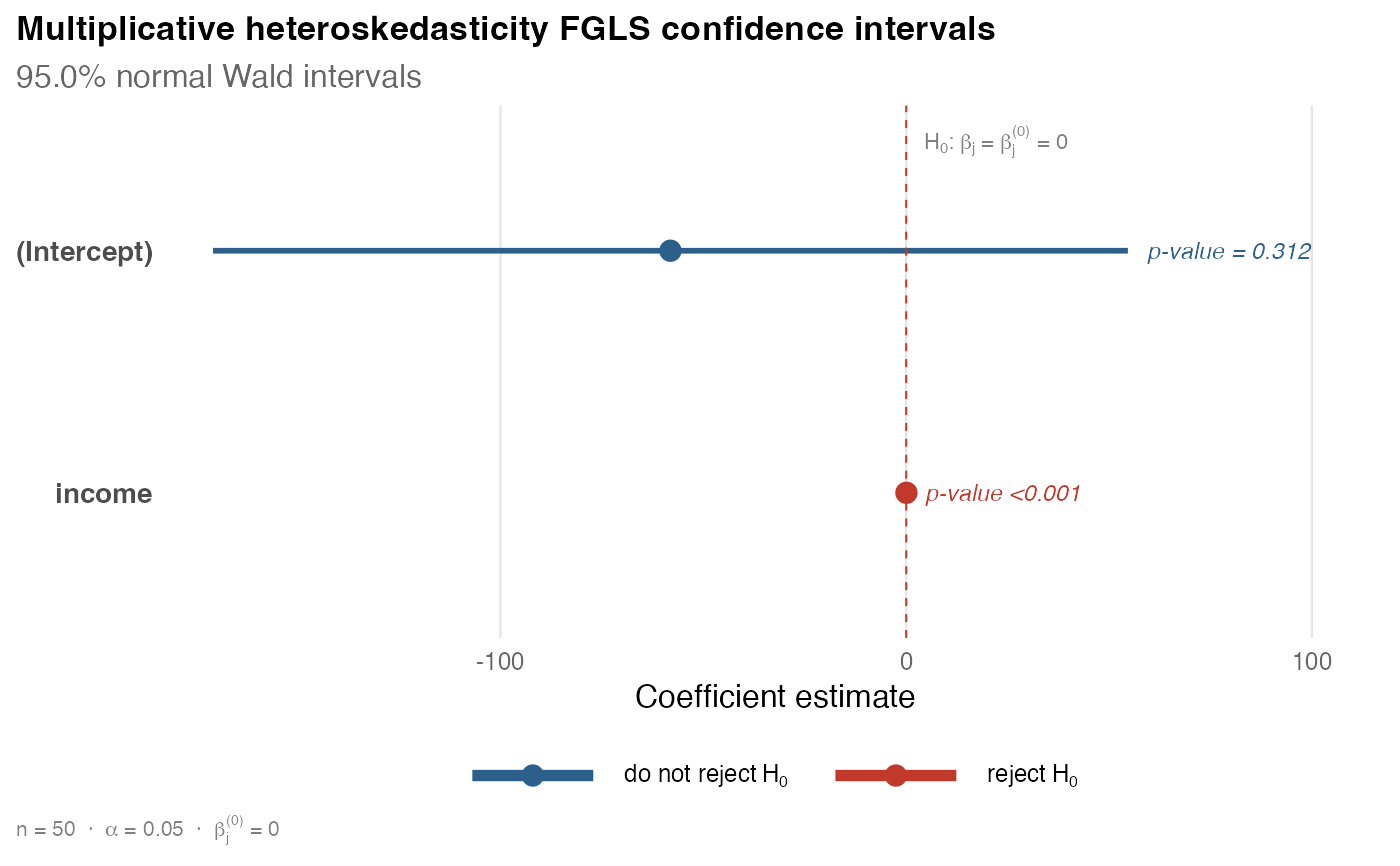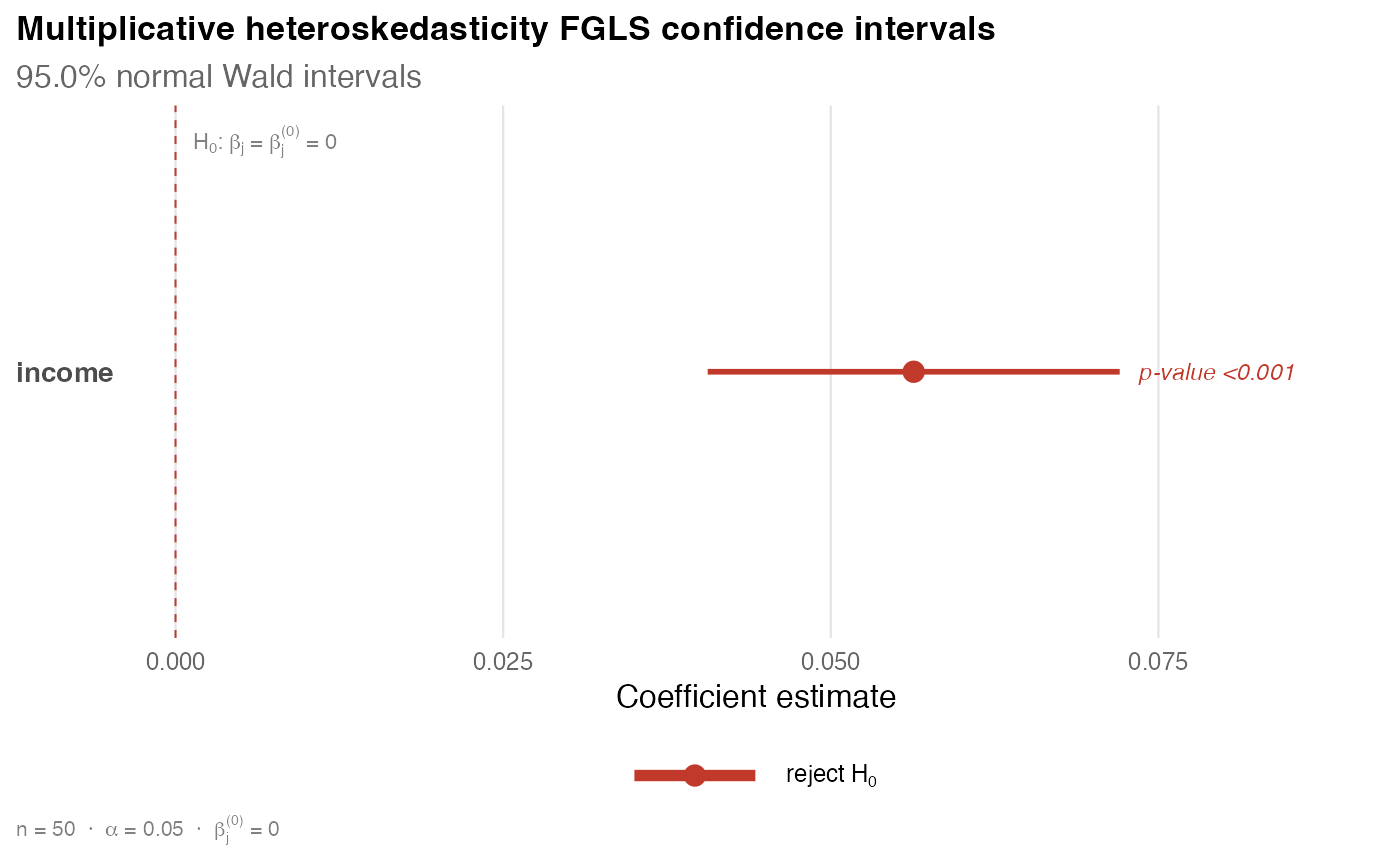
Plots the normal Wald confidence intervals for the mean coefficients of a
gls_mult() fit, color-coded by the test decision at the stored significance
level, matching plot.hcinfer(). Only the mean block is shown, consistent
with confint.gls_mult() and tests.gls_mult().
Usage
# S3 method for class 'gls_mult'
plot(x, parm, ...)
Arguments
- x
An object returned by
gls_mult().- parm
Optional coefficient names or integer positions. Selection follows the same rules as
confint.gls_mult()andtests.gls_mult().- ...
Unused. Passing named arguments raises an error.
Value
A ggplot2::ggplot() object.