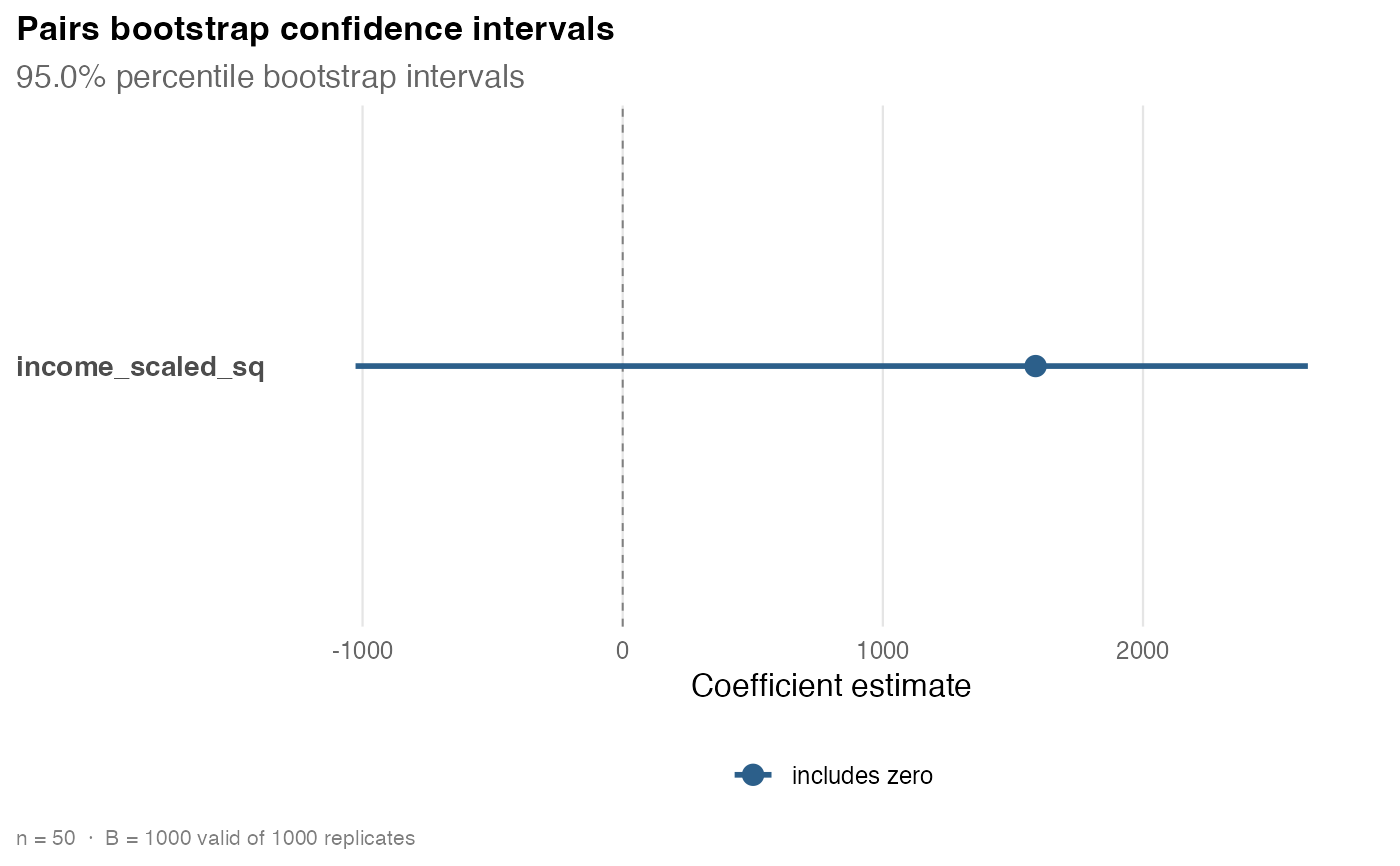
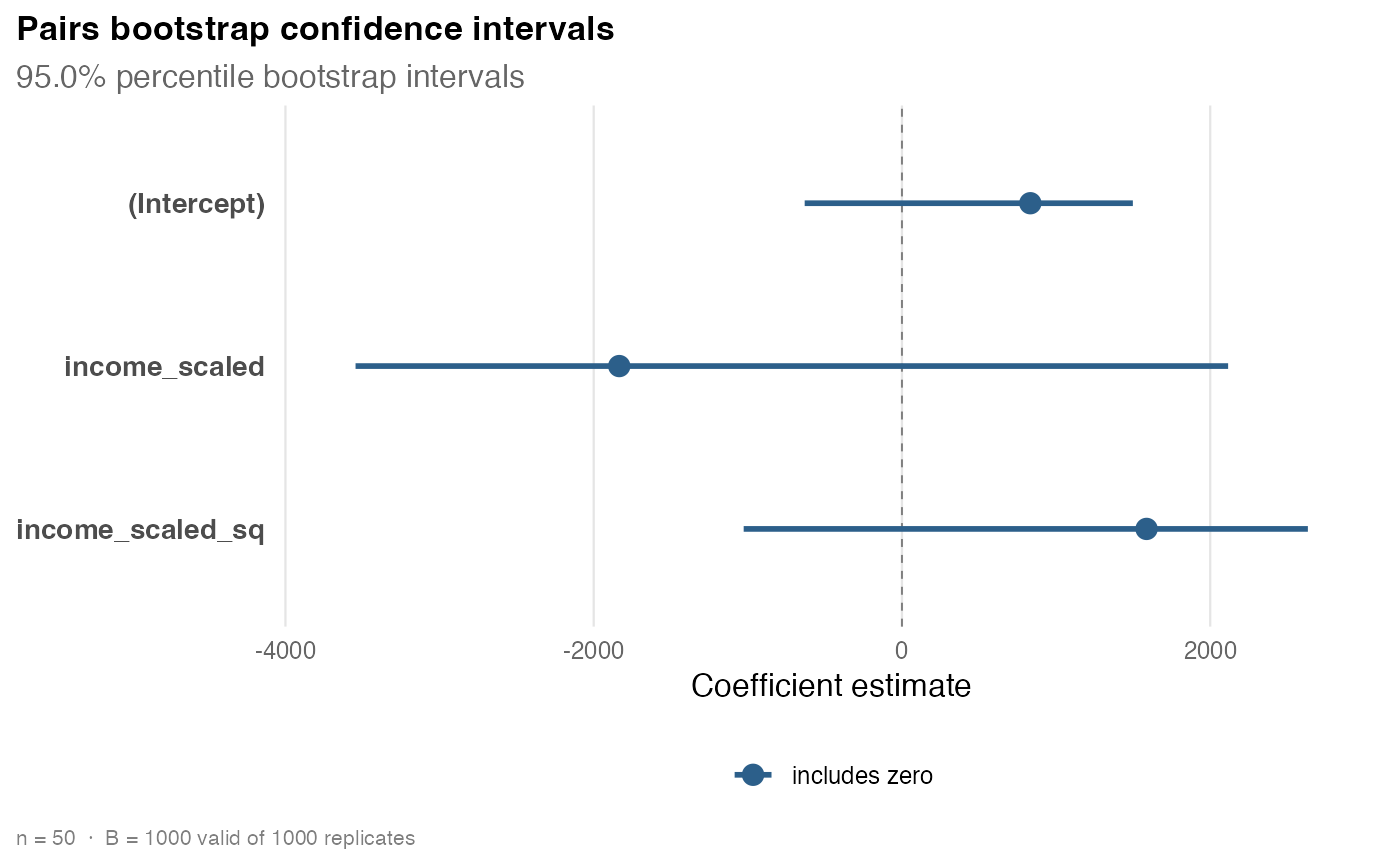
Plots the pairs bootstrap confidence intervals stored in a boot_pairs()
object. Each coefficient is drawn as its ordinary least squares point estimate
with a horizontal bootstrap interval, color-coded by whether the interval
excludes zero (shown in red) or includes zero (shown in blue). A dashed
vertical reference line is drawn at zero.
Usage
# S3 method for class 'hcinfer_boot'
plot(x, parm, ...)
Arguments
- x
An object returned by
boot_pairs().- parm
Optional coefficient names or integer positions. When supplied, only the selected coefficients are plotted, following the same rules as
confint.hcinfer_boot().- ...
Unused. Passing named arguments raises an error.
Value
A ggplot2::ggplot() object.
Examples
schools <- PublicSchools |>
dplyr::mutate(
income_scaled = income / 10000,
income_scaled_sq = income_scaled^2
)
fit <- lm(expenditure ~ income_scaled + income_scaled_sq, data = schools)
boot <- boot_pairs(fit, B = 1000, seed = 123)
plot(boot)
 plot(boot, parm = "income_scaled_sq")