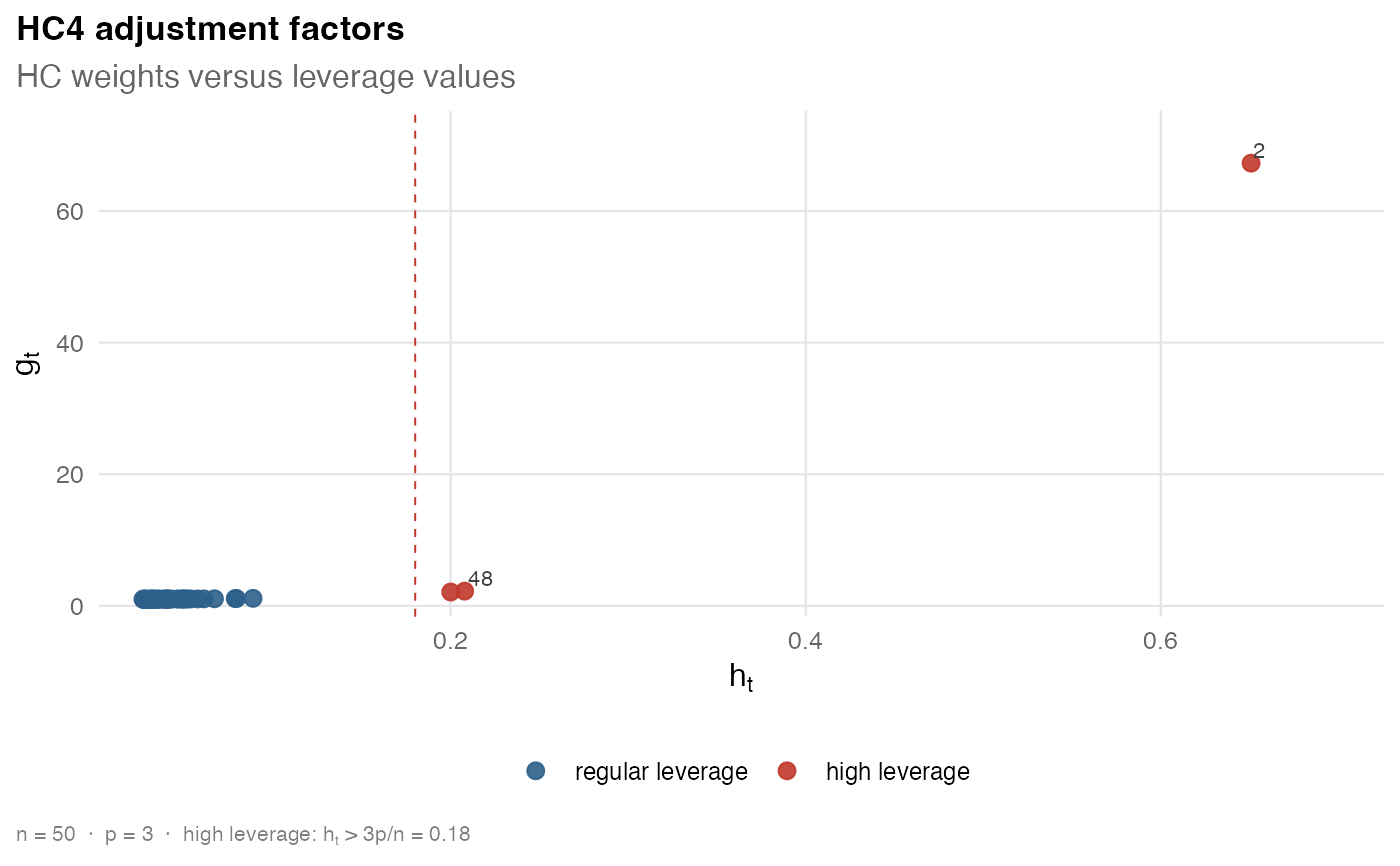
Plots the HC adjustment factors \(g_t\) against the leverage values
\(h_t\) stored in a vcov_hc() object. Points with
\(h_t > 3p/n\) are highlighted because this threshold is commonly used to
flag high-leverage observations in the empirical examples from the HCbeta
paper.
Usage
# S3 method for class 'hcinfer_vcov'
plot(x, label_top = 3, ...)
Arguments
- x
An object returned by
vcov_hc().- label_top
A nonnegative whole number. The observations with the largest adjustment factors are labeled. Use
0to suppress labels.- ...
Unused. Passing named arguments raises an error.
Value
A ggplot2::ggplot() object.